Tools That Fast-Track You To DSP Solutions
More About Sketch-a-Filt
 Navigating Sketch-a-Filt and Some of its Features (12:54)
 A Birdwing-Shaped Bandpass Filter (02:29)
 Unleashing Ripple To Reduce Transition Width in Digital Filters (08:56)
 Template Violation Following Coefficient Quantization (04:50)
 Converting a Reduced-Delay FIR Filter to IIR (04:47)
More Details for Sketch-A-Filt

 Currently Sketch-a-Filt Is Not Available For Standalone Purchase
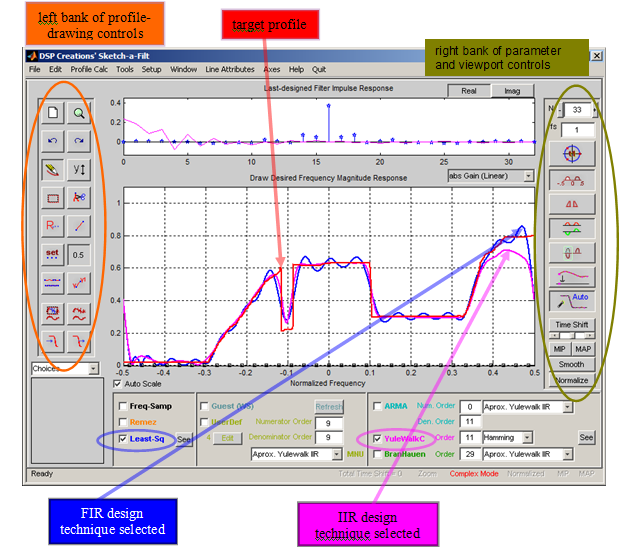
- Upon typing sketchafilt in the MATLAB Command Line, the Sketch-a-Filt GUI comes up, forming the primary design platform for the FIR and/or IIR design work
- This GUI has two exhibits: a long impulse response display and, below that, the larger frequency-domain display, showing the (red) target profile WHICH HAS BEEN MOUSE-DRAWN defining a desired multiband complex-coefficient gain profile - and (in
purple) one 33-coefficient FIR approximation.
- Also (in magenta) is shown a 11th-order IIR curve approximating the red profile. Further highlights are the control parameter clusters and 2 (of 6 available at "top-level") selected checkboxes for the design techniques currently in force:
- You may radically and immediately change the design target and its two approximations simply by mouse-drawing some change to the red target profile
- Pole-zero patterns for the two (or more, if desired) and other filter credentials can be depicted in a separate dedicated visualization figure window by invoking "See All Filters" under the "Tools" menu item near the top of the GUI
- Many more design techniques can be unleashed by selecting from a host of "second-level" techniques (incorporating algorithms you develop yourself, alongside three dozen-plus "factory-supplied" specialist routines) lodged under the UserDef feature of this tool
- Thus it is easy to compare a broad range of design styles, exploiting a powerful standardized test and measurement environment
Currently Sketch-a-Filt Is Not Available For Standalone Purchase
- All three of our software products are incorporated into the software package supporting the Training Courses described under "Services" on this website.
- To arrange an on-site course please contact Dr. Gerald D Cain, Email: cain@dspcreations.com